
打造一套NGINX监控
打造一套NGINX监控
0. 前文
笔者之前无意查看nginx的访问日志access.log文件,发现有很多的像/phpMyadmin/index.php这种访问,IP归属地来自世界各地,应该有人在用肉鸡在一直扫描服务器漏洞,就萌生了想打造一套nginx监控系统的想法。我的要求很简单,只要能在网站上实时查看日志就行,不用每次去服务器查看。最开始我想到的是ELK这套解决方案,我之前我了解过,但是后面想了一下,ELK有点太重了,主要是核心的部件Elasticsearch是用Java写的,比较占资源,用在我这里有点杀鸡用牛刀的感觉(服务器扛不住)。后面在网上查找的时候,了解到了loki+promtail+grafana的这套轻量级解决方案,便决定部署来试试看。
以下操作使用的是Centos 7进行演示
1. 安装nginx
编译nginx,加载ngx_http_geoip2_module模块,获取访问ip的geoip2区域信息
1.1 下载、编译nginx
# 安装编译环境
$ yum -y install gcc pcre pcre-devel zlib zlib-devel openssl openssl-devel
# 下载安装libmaxminddb
$ wget https://github.com/maxmind/libmaxminddb/releases/download/1.3.2/libmaxminddb-1.3.2.tar.gz
$ tar -zxvf libmaxminddb-1.3.2.tar.gz
$ cd libmaxminddb-1.3.2
$ ./configure && make && make install
$ echo /usr/local/lib  >> /etc/ld.so.conf.d/local.conf
$ ldconfig
# 下载ngx_http_geoip2_module模块
$ yum install -y git
$ git clone https://github.com/leev/ngx_http_geoip2_module
# 下载编译nginx
$ wget https://nginx.org/download/nginx-1.18.0.tar.gz
$ tar -zxvf nginx-1.18.0.tar.gz
$ cd nginx-1.18.0
# 如果之前已经安装过nginx,可以用/path/to/nginx/sbin/nginx -V查看nginx编译参数
# /root/ngx_http_geoip2_module换成你自己的路径
$ ./configure --prefix=/usr/local/nginx --with-http_ssl_module --add-module=/root/ngx_http_geoip2_module
$ make && make install
1.2 下载GeoLite2数据库
maxmind官网下载,能下载最新的,但需要注册登录
笔者提供的,不是最新的,但应该也够用
GeoLite2-City_20220705.tar.gz
GeoLite2-Country_20220705.tar.gz
$ tar -zxvf GeoLite2-City_20220705.tar.gz
$ mv ./GeoLite2-City_20220705/GeoLite2-City.mmdb /usr/local/nginx/conf
$ tar -zxvf GeoLite2-Country_20220705.tar.gz
$ mv ./GeoLite2-Country_20220705/GeoLite2-Country.mmdb /usr/local/nginx/conf
1.3 配置nginx
需要将日志格式配置成JSON,里面包含了geoip_country_code
http {
    include       mime.types;
    default_type  application/octet-stream;

    log_format json_analytics '{'
                    '"msec": "$msec", ' # request unixtime in seconds with a milliseconds resolution
                    '"connection": "$connection", ' # connection serial number
                    '"connection_requests": "$connection_requests", ' # number of requests made in connection
                    '"pid": "$pid", ' # process pid
                    '"request_id": "$request_id", ' # the unique request id
                    '"request_length": "$request_length", ' # request length (including headers and body)
                    '"remote_addr": "$remote_addr", ' # client IP
                    '"remote_user": "$remote_user", ' # client HTTP username
                    '"remote_port": "$remote_port", ' # client port
                    '"time_local": "$time_local", '
                    '"time_iso8601": "$time_iso8601", ' # local time in the ISO 8601 standard format
                    '"request": "$request", ' # full path no arguments if the request
                    '"request_uri": "$request_uri", ' # full path and arguments if the request
                    '"args": "$args", ' # args
                    '"status": "$status", ' # response status code
                    '"body_bytes_sent": "$body_bytes_sent", ' # the number of body bytes exclude headers sent to a client
                    '"bytes_sent": "$bytes_sent", ' # the number of bytes sent to a client
                    '"http_referer": "$http_referer", ' # HTTP referer
                    '"http_user_agent": "$http_user_agent", ' # user agent
                    '"http_x_forwarded_for": "$http_x_forwarded_for", ' # http_x_forwarded_for
                    '"http_host": "$http_host", ' # the request Host: header
                    '"server_name": "$server_name", ' # the name of the vhost serving the request
                    '"request_time": "$request_time", ' # request processing time in seconds with msec resolution
                    '"upstream": "$upstream_addr", ' # upstream backend server for proxied requests
                    '"upstream_connect_time": "$upstream_connect_time", ' # upstream handshake time incl. TLS
                    '"upstream_header_time": "$upstream_header_time", ' # time spent receiving upstream headers
                    '"upstream_response_time": "$upstream_response_time", ' # time spend receiving upstream body
                    '"upstream_response_length": "$upstream_response_length", ' # upstream response length
                    '"upstream_cache_status": "$upstream_cache_status", ' # cache HIT/MISS where applicable
                    '"ssl_protocol": "$ssl_protocol", ' # TLS protocol
                    '"ssl_cipher": "$ssl_cipher", ' # TLS cipher
                    '"scheme": "$scheme", ' # http or https
                    '"request_method": "$request_method", ' # request method
                    '"server_protocol": "$server_protocol", ' # request protocol, like HTTP/1.1 or HTTP/2.0
                    '"pipe": "$pipe", ' # "p" if request was pipelined, "." otherwise
                    '"gzip_ratio": "$gzip_ratio", '
                    '"http_cf_ray": "$http_cf_ray",'
                    '"geoip_country_code": "$geoip2_data_country_code"'
                    '}';

    access_log  logs/json_access.log  json_analytics;

    geoip2 /usr/local/nginx/conf/GeoLite2-Country.mmdb {
        $geoip2_data_country_code country iso_code;
        $geoip2_data_country_name country names en;
    }

    geoip2 /usr/local/nginx/conf/GeoLite2-City.mmdb {
        $geoip2_data_city_name city names en;
        $geoip2_data_province_name subdivisions 0 names en;
    }
}
1.4 启动nginx
$ /usr/local/nginx/sbin/nginx
2. 安装loki、promtail、grafana
使用docker部署,需要提前安装好docker,这里不再赘述,具体参见docker官网
2.1 loki配置文件
auth_enabled: false

server:
  http_listen_port: 3100
  grpc_listen_port: 9096

common:
  path_prefix: /tmp/loki
  storage:
    filesystem:
      chunks_directory: /tmp/loki/chunks
      rules_directory: /tmp/loki/rules
  replication_factor: 1
  ring:
    instance_addr: 127.0.0.1
    kvstore:
      store: inmemory

schema_config:
  configs:
    - from: 2020-10-24
      store: boltdb-shipper
      object_store: filesystem
      schema: v11
      index:
        prefix: index_
        period: 24h

ruler:
  alertmanager_url: http://localhost:9093
frontend:
  # Maximum number of outstanding requests per tenant per frontend; requests
  # beyond this error with HTTP 429.
  # CLI flag: -querier.max-outstanding-requests-per-tenant
  max_outstanding_per_tenant: 2048 # default = 100
query_range:
  # Perform query parallelisations based on storage sharding configuration and
  # query ASTs. This feature is supported only by the chunks storage engine.
  # CLI flag: -querier.parallelise-shardable-queries
  parallelise_shardable_queries: false # default = true
compactor:
  retention_enabled: true
  retention_delete_delay: 1m
  delete_request_cancel_period: 1m
也可从官网下载模板
$ wget https://raw.githubusercontent.com/grafana/loki/v2.6.1/cmd/loki/loki-local-config.yaml -O loki-config.yaml
2.2 promtail配置文件
server:
  http_listen_port: 9080
  grpc_listen_port: 0

positions:
  filename: /tmp/positions.yaml

clients:
  - url: http://loki:3100/loki/api/v1/push

scrape_configs:
- job_name: system
  static_configs:
  - targets:
      - localhost
    labels:
      job: nginxlogs
      __path__: /var/log/json_access.log
也可从官网下载模板
$ wget https://raw.githubusercontent.com/grafana/loki/v2.6.1/clients/cmd/promtail/promtail-docker-config.yaml -O promtail-config.yaml
2.3 docker-compose.yml配置文件
version: '3'
networks:
  loki:
services:
  loki:
    image: "grafana/loki:2.5.0"
    ports:
     - "3100:3100"
    volumes:
     - /usr/local/Loki/conf:/etc/loki
    command: -config.file=/etc/loki/loki-config.yaml
    networks:
     - loki
    restart: always
  promtail:
    image: "grafana/promtail:2.5.0"
    volumes:
      - /usr/local/Loki/conf:/etc/promtail
      - /usr/local/nginx/logs:/var/log
    command: -config.file=/etc/promtail/promtail-config.yaml
    networks:
      - loki
    restart: always
  grafana:
    image: grafana/grafana:latest
    ports:
      - "3000:3000"
    networks:
      - loki
    restart: always
也可从官网下载模板
$ wget https://raw.githubusercontent.com/grafana/loki/v2.6.1/production/docker-compose.yaml -O docker-compose.yaml
注意事项:配置文件的位置以自己的为准(修改volumes),我都是放在/usr/local/Loki/conf中
2.4 启动loki、promtail、grafana
$ docker-compose up -d
3. 配置Dashboard
都成功启动后,就应该可以正常访问了,grafana的默认端口是3000,可以根据需要进行映射或者再进行代理,笔者建议直接带端口访问,不需要再用nginx进行代理,若是需要用nginx进行代理,要牢记,不要让访问grafana的日志出现在nginx中,否则你每次访问grafana,看到的都是访问它自己的日志。
nginx不记录日志配置
access_log off;
3.1 登录grafana

默认账号密码是admin/admin,登录后记得修改密码
3.1 添加数据源
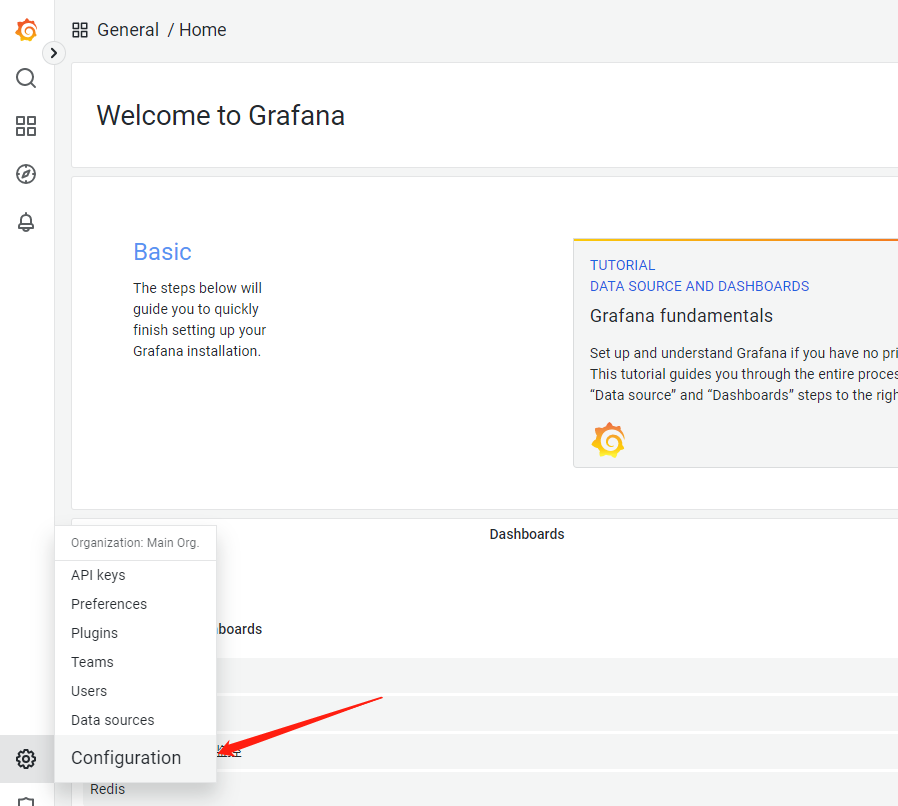
点击添加数据源,选择Loki

URL输入http://loki:3100,点击保存和测试,出现'Data source connected and labels found'的提示就OK了
3.1 添加Dashboard
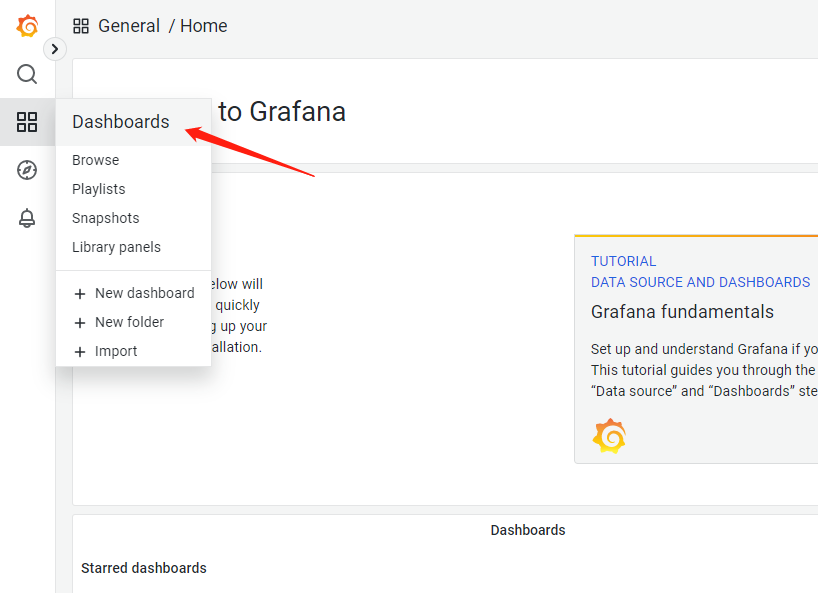
点击import,输入12559,再导入,这是别人制作好的现成的模板,你也可以自己制作属于自己的模板,或者去grafana搜索模板,grafana dashboards
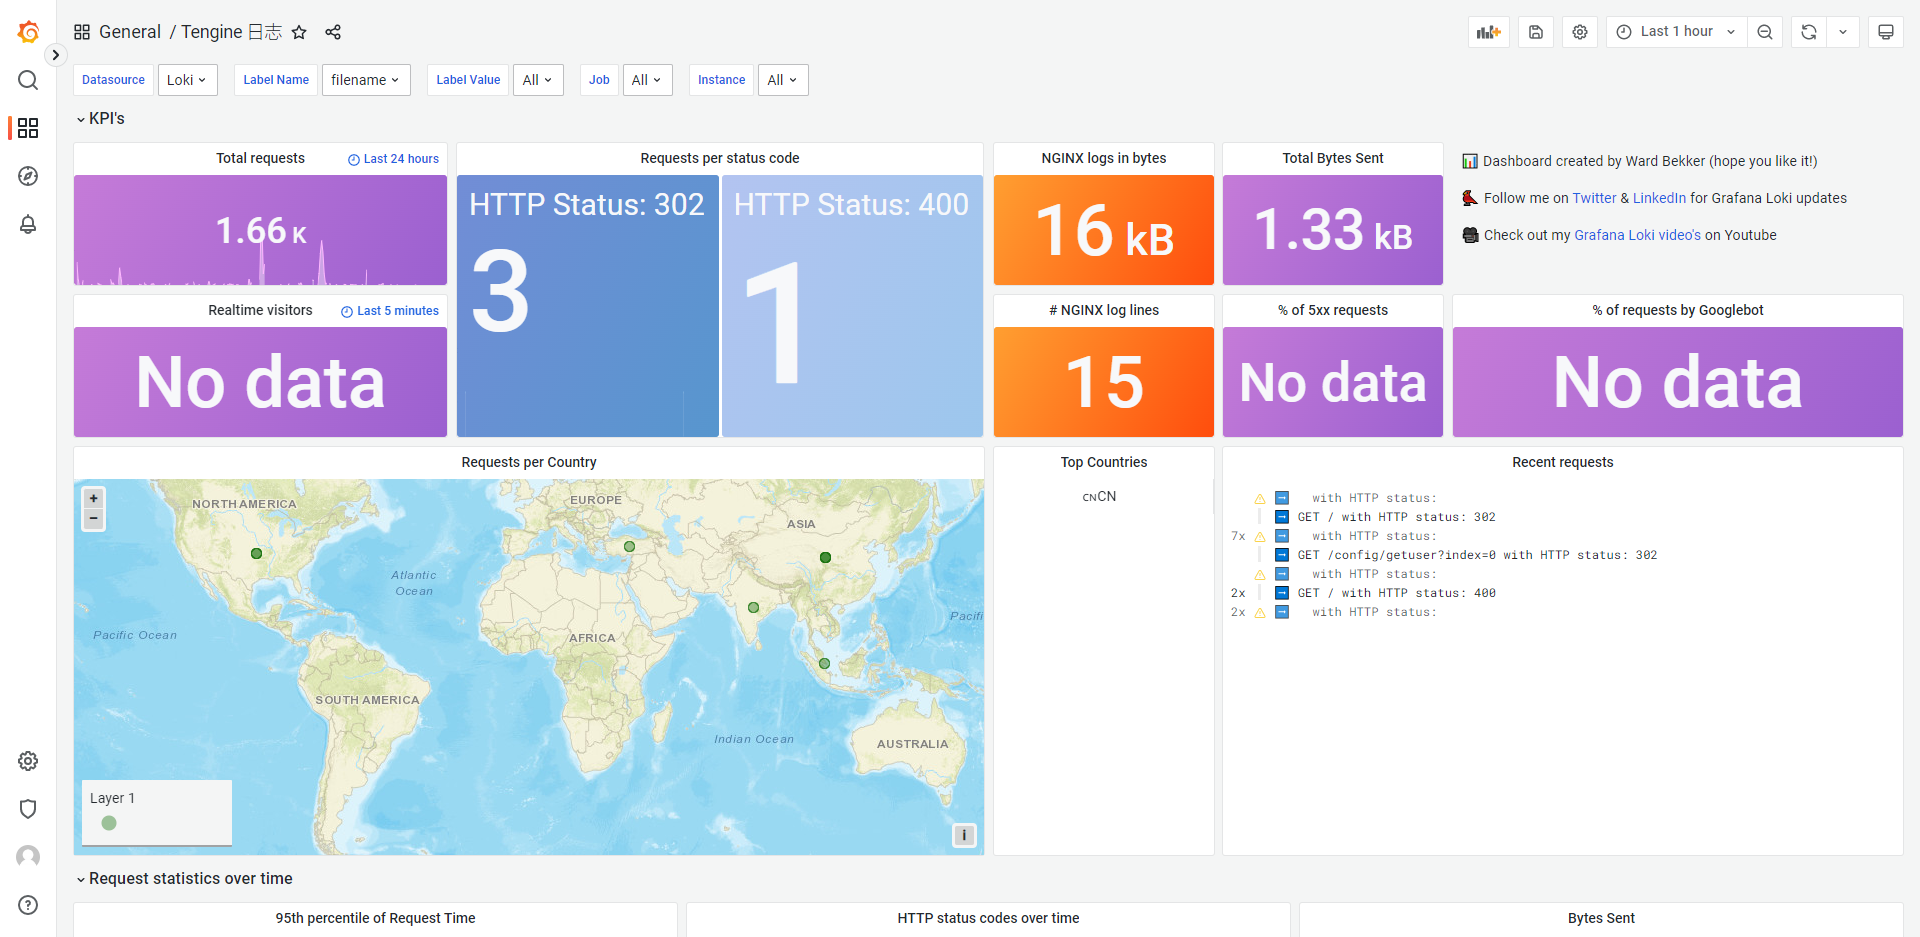
现在大功告成!
注意事项:配置较差的机器(轻量应用服务器)不要选择太长的时间区间进行搜索,会很慢,甚至报错